TRADACITY
Tick by tick Daytrading Simulator
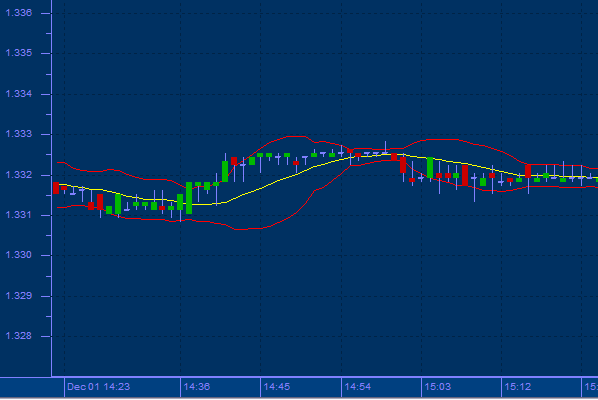
Fractal Chaos Bands
E. W. Dreiss, a trader based in Australia, came up with the creative idea of using fractal geometry as a way to measure price movement in a security. The chaotic nature of stock market movements explains why it is sometimes difficult to distinguish hourly charts from monthly charts if the time scale is not given. The patterns are similar regardless of the time resolution. Each level is like the one before it, but the size is different. To determine what is happening in the current level of resolution, the fractal chaos band indicator can be used to examine these patterns. This is an excellent indicator to use in intra-day trading.
Usage:
The indicator ‘looks back’ in time depending on the number of time periods selected to plot the indicator. The slope of the bands is a good indicator of the choppiness or trendiness of the markets. the bands essentially flatten out in choppy markets and have a +ve or -ve slope in trending markets. The upper band is plotted based on interval highs and the lower band is plotted based on interval lows. Other way to look at the bands is as filters that filter out minor fluctuations and offer better picture of the price action..